


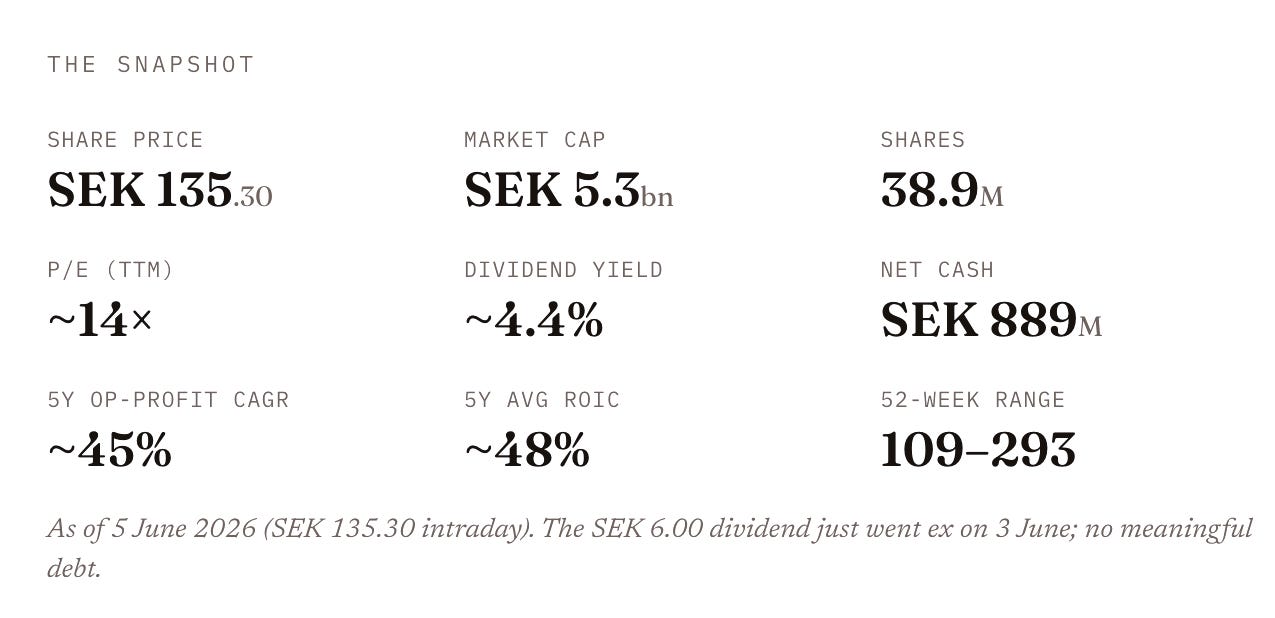
Zinzino AB (STO: ZZ B) is a Gothenburg-based direct seller of test-based personalized nutrition, listed on Nasdaq First North Growth Market since 2014 and trading at around SEK 135. Most serious investors scroll right past it. It's a direct seller, multi-level marketing, network sales, pick whichever label trips your gag reflex, that ships fish oil and personalized supplements through an army of independent distributors. The three letters "MLM" do an enormous amount of work scaring capital away.
That reflex is the whole opportunity. Strip the label off and read the statements, and you find a debt-free, cash-generative business that has compounded operating profit at roughly 45% a year for five years, earns a ~48% return on invested capital, and trades at about 14× earnings with a 4%-plus dividend. So one of two things is true. Either the market is right that this is a fragile pyramid about to topple — or it’s mispricing a genuinely good business because of the company it keeps. This is my attempt to settle that with numbers, not adjectives.
What Zinzino actually is
Zinzino is a Gothenburg-based, Nasdaq First North–listed direct seller founded in 2007. Its hook is genuinely differentiated for the category: test-based, personalized nutrition. You take a home blood test — the BalanceTest — which measures your omega-6 : omega-3 ratio; the company sells you the protocol to fix it, then re-tests to prove it worked. That test → sell → re-test loop is the moat management keeps pointing at, because it turns a commodity (fish oil) into a measurable, subscription-friendly outcome.
Three mechanics matter for an investor:
Recurring revenue in disguise. Most sales run through six-month subscriptions that auto-renew until cancelled — recurring revenue dressed up as network marketing.
Asset-light and global. Products ship from one web shop to 100-plus markets. Zinzino owns its Norwegian R&D and production units (Faun Pharma, BioActive Foods); the sales force is independent distributors it pays no salary.
Growth by acquisition, paid in stock. It has spent recent years buying distributor networks — Valentus, Zurvita, Truvy, Bodé Pro, Sanki, ItWorks — and running them through its own product engine. The deals are funded with cash and shares, not debt, so it has scaled to billions in revenue while staying net cash.
If you want the canonical case that a well-run direct seller can be a wonderful business, remember Buffett bought The Pampered Chef in 2002. The model isn’t the problem. Execution is.
The quarter Zinzino's profitability inflected: Q1 2026
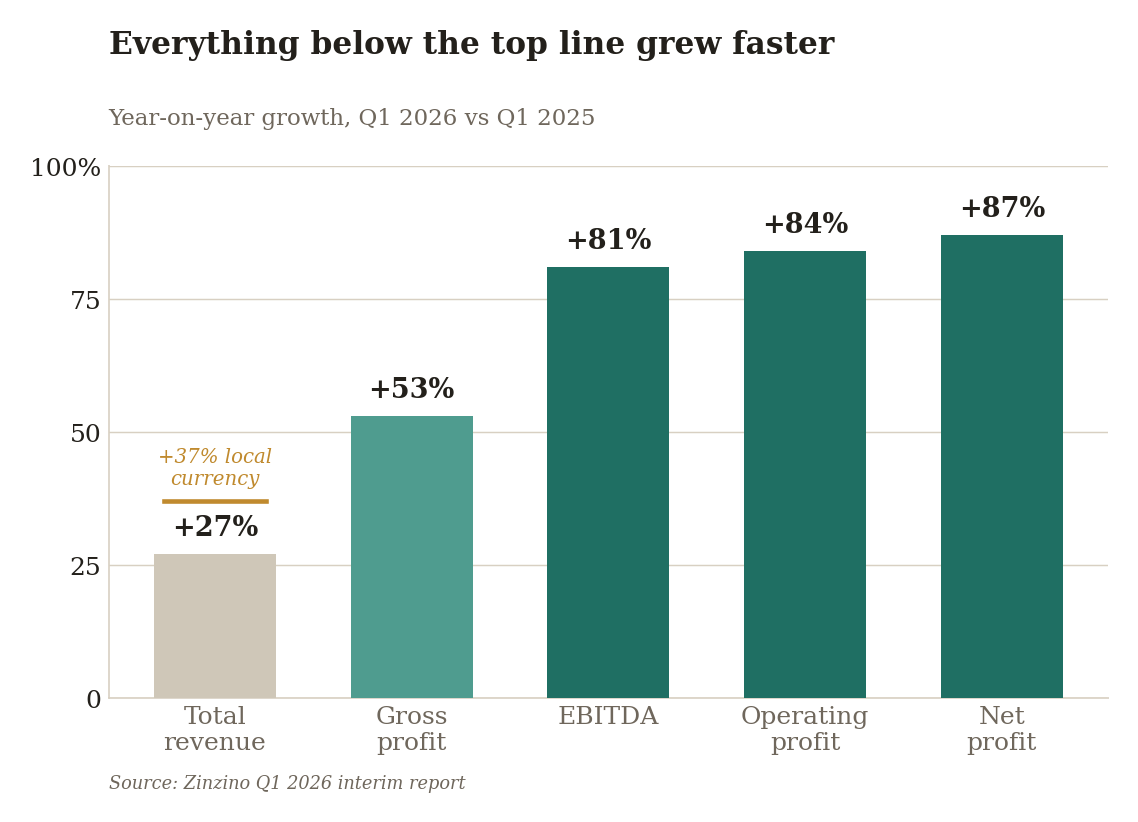
The Q1 2026 report (released 22 May 2026) is where operating leverage stops being a thesis and becomes arithmetic. Revenue grew 27% — but every line beneath it grew faster.
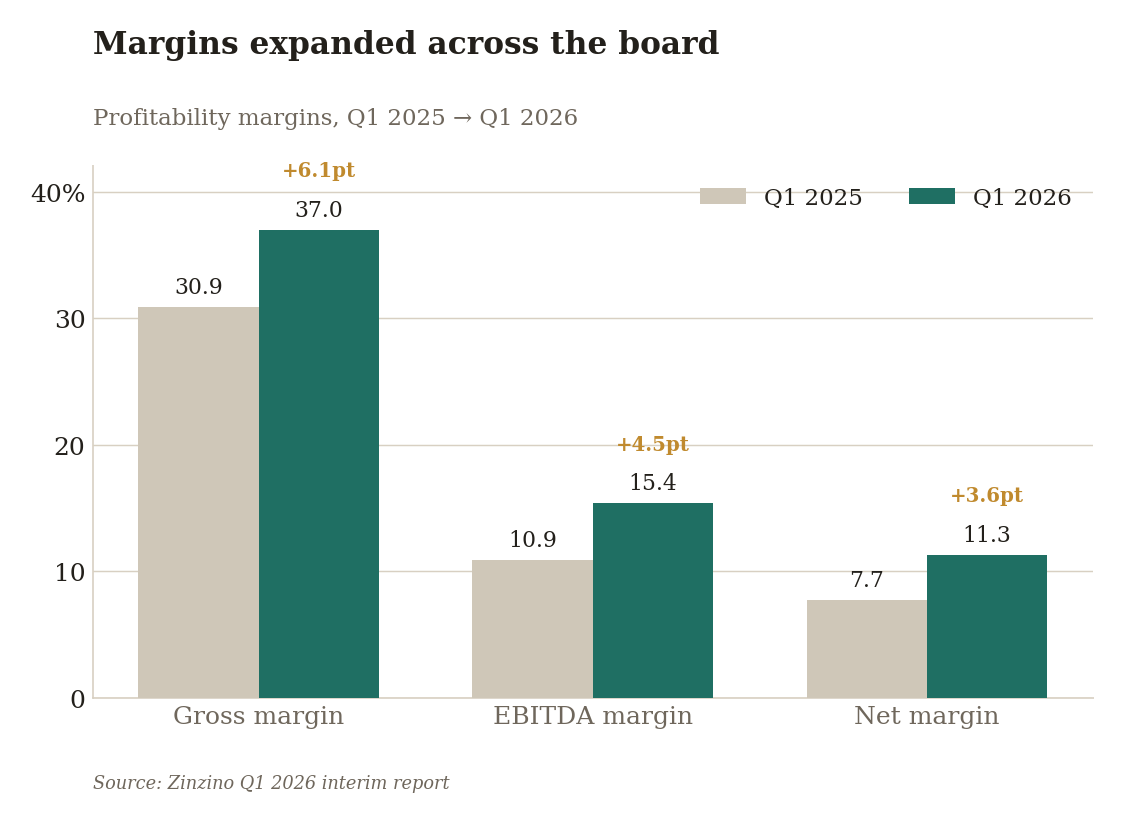
The margin stack tells the same story from the other side. Gross margin jumped 6.1 points to 37.0%, the EBITDA margin 4.5 points to 15.4%, and the net margin to 11.3%.
The balance sheet followed the income statement. Cash rose to SEK 889M, the equity ratio to 50.4% (from 34.6%), and book value per share to SEK 31. Net profit cleared SEK 100M for the first time, and operating cash flow went from a rounding error (SEK 21M) to SEK 126M — roughly six times higher. The CEO called it a “record quarter”; for once the press-release adjective survives contact with the numbers.
When the bottom line grows three times faster than the top, you’re watching operating leverage, not spin.
The catch you have to respect: May was soft
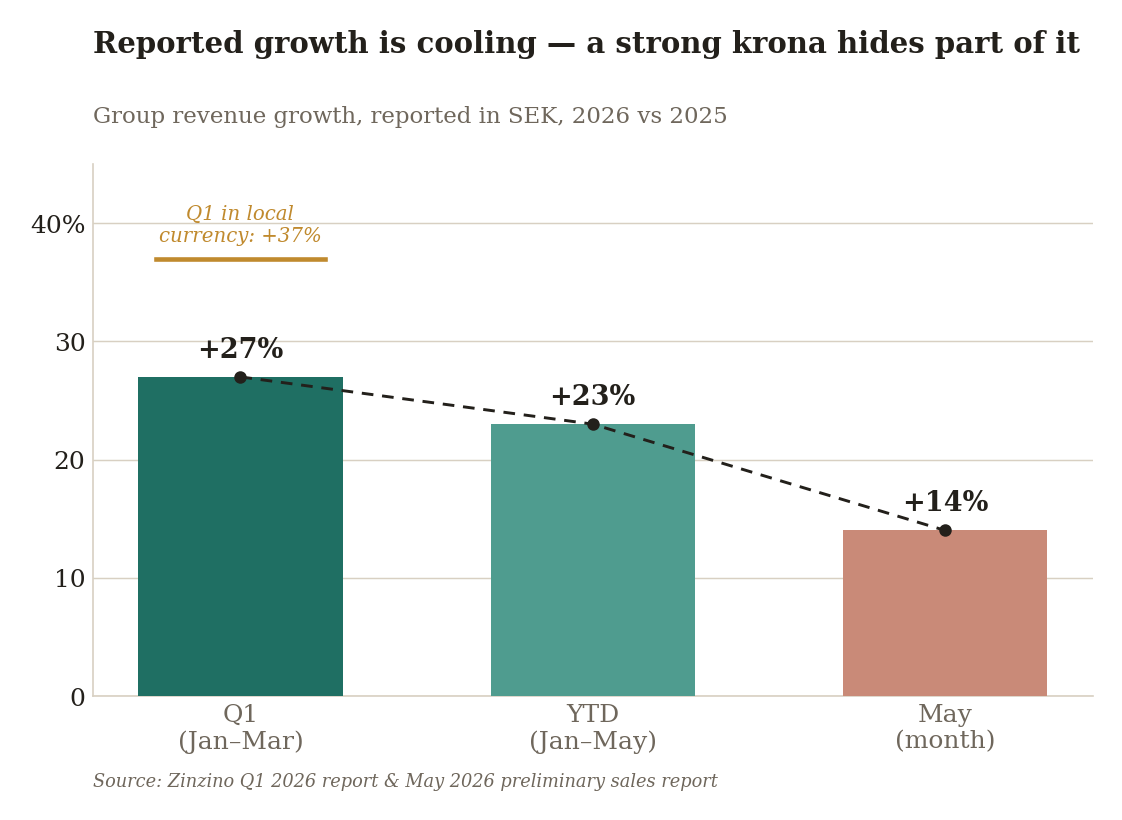
#NumbersNotNarrative cuts both ways, so here’s the other side of the ledger. The preliminary May sales report (3 June 2026) showed group revenue up just 14% to SEK 316M, pulling January–May growth down to +23%. After +27% in Q1, that’s a visible deceleration.
Three things to hold in your head at once:
FX is masking the real number. May’s 14% is reported in SEK, and the krona has strengthened. In Q1 the gap between reported (+27%) and local-currency (+37%) growth was a full ten points. May’s local-currency figure was almost certainly well above 14% — Zinzino just doesn’t publish it monthly.
The comparables are stiffening. Q2 2025 was already a SEK 794M quarter; the easy year-ago layups are gone.
It still beats the plan. Management’s 2026–2028 target is ≥20% sales growth at a >11% EBITDA margin. The thesis never needed 50% growth — it needs ~20% at expanding margins. That is exactly what’s on the board.
Zinzino's growth is becoming a geography story
Break the year-to-date number into regions and the single most important picture in this whole post appears: a two-speed business.
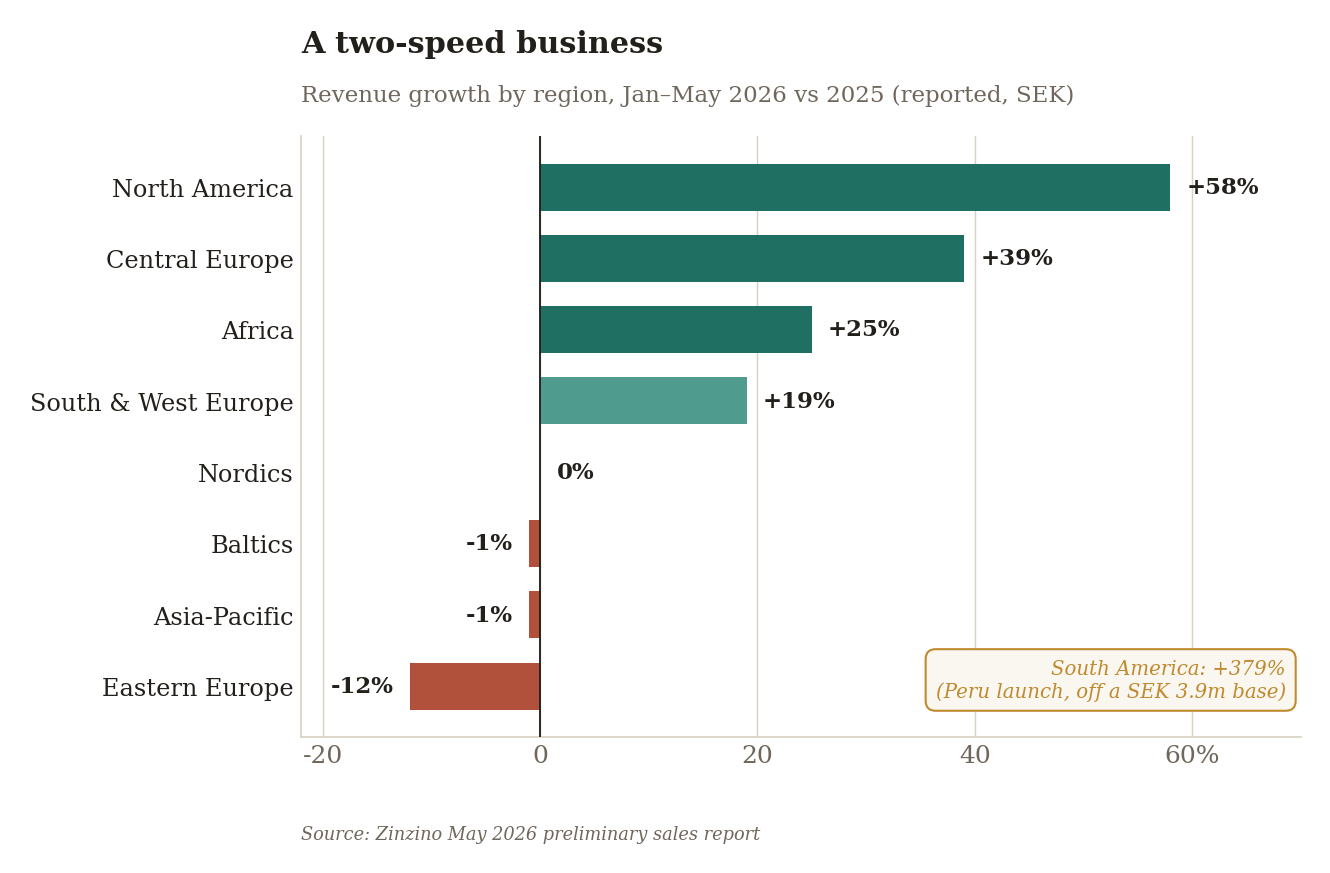
Carrying the load: North America +58% — the engine room, now home to ItWorks, Sanki, Truvy, Bodé Pro and Zurvita; the region jumped from 15% to 21% of group revenue. South America +379% off a tiny base (Peru launched in February as the continent’s first official market, Colombia next). Central Europe +39% — the most reassuring line, because it’s broad-based organic strength, not a bolt-on.
Going backwards: Eastern Europe −12%, Asia-Pacific and the Baltics −1%, the Nordics flat. India cratered inside APAC; Turkey — where a large distributor organization walked in 2025 — gutted an otherwise strong Southern & Western Europe.
The honest bear read: a growing share of the headline is bought, not grown. The bull read: that is the strategy — buy distributor networks cheaply, run them through the test-based engine, harvest the margin — and Q1’s margin expansion while integrating ItWorks is the receipt that the playbook converts. Both are true. Which one dominates over the next four quarters is the real debate.
Acquisitions, and the dilution bill
Funding deals with stock keeps the balance sheet pristine and quietly dilutes you. In Q1 alone, ItWorks (26 Jan) cost SEK 291M entirely in new shares (1.84M Class B at SEK 145.62), contributed SEK 69M of revenue in about two months, and is guided to add >USD 45M in 2026; Sanki (effective 1 Jan) cost SEK 75M, mostly stock, and was the key that opened South America; Bodé Pro added another ~70,000 shares.
Share count has drifted up to roughly 38.9M, and warrant holders keep nudging it higher. If every remaining warrant were exercised, that’s ~1.79M new Class B shares — about 4.6% dilution — struck between SEK 56 and SEK 271.60. The good news for per-share math: the big SEK 271.60 programs running to 2030 are deeply out of the money at ~SEK 135, so the most dilutive tranches only bite if the stock roughly doubles. When you build owner earnings, charge yourself the economic cost of that gap — but note it shrinks as the quote falls.
My own back-of-envelope owner earnings — normalizing out 2025’s working-capital tailwind, maintenance capex, warrant dilution and maintenance M&A — lands near SEK 366M. Against ~20% growth, that’s a PEG comfortably under 1. Cheap, for this quality.
Valuing Zinzino: priced like it's about to roll over
At ~SEK 135 on 5 June 2026, rolling Q1 into the trailing twelve months puts net profit near SEK 373M (~SEK 9.6 of EPS), so you’re paying roughly 14× earnings for a business with a five-year ~45% operating-profit CAGR, ~48% ROIC, SEK 889M of net cash, a ~4.4% dividend (just gone ex), and a 20%-plus near-term growth runway.
The stock has been brutalized. It ran to SEK 293 in mid-2025 before short-selling pressure and a broker note flagging “some moderation of growth” knocked it into the low 100s; it bounced toward the mid-140s and now changes hands around SEK 135. The sell-side consensus target sits around SEK 215–222 — though it was recently trimmed from ~SEK 234, which is precisely the “moderation” the bears are pressing. Do with that what you will.
Insiders send a mixed-but-leaning-constructive signal. In mid-April 2026 the CEO, Dag Bergheim Pettersen, 56 and fourteen years at the helm, exercised 100,000 options at a ~SEK 63 strike (about SEK 6.3M of his own cash) and kept the shares, holding roughly 1.2–1.3M directly. Set against that, company insiders as a group have been net sellers by around SEK 37M over the past year, and the Chairman trimmed earlier in the spring. The man who knows the order book best is adding; the broader insider tape is not a one-way buy. Weigh both.
The bear case on Zinzino
Growth normalization is real. May’s +14% SEK print is Exhibit A, and the flat-to-negative mature regions back it up.
MLM structural risk. Distributor-led models can unwind fast when momentum reverses (see Turkey). Regulatory scrutiny of direct selling is a permanent overhang.
Acquisition dependence. If the deal pipeline slows or integrations stumble, the organic base may not be enough to hit 20%.
Dilution and FX. Stock-funded M&A and a strengthening krona both eat reported per-share growth.
None of that is dismissible. But weigh it against a quarter in which net income crossed SEK 100M, cash flow rose roughly sixfold, and margins expanded ~450bps while integrating an acquisition. That is not a business breaking. That is a business proving its model scales.
What I'm watching into Q2 (reports 25 August 2026)
Local-currency growth — does the FX-adjusted number stay above 20%?
Organic vs. acquired — any stabilization in the Nordics, Baltics, Eastern Europe?
ItWorks synergies — Q1 baked in none; Q2 is when the goodwill is supposed to start earning its keep.
Margin durability — that 37% gross margin rode a weak dollar; how much holds if the greenback turns?
The market is underwriting "an MLM about to roll over." The financials describe a high-ROIC, cash-generative compounder at ~14× with a 4%-plus yield. Those two stories can't both be true for long. My money, literally, is on the numbers.
Sources. Zinzino AB (STO: ZZ B) Q1 2026 interim report published 22 May 2026 and the preliminary May 2026 sales report published 3 June 2026. Insider transactions from the Swedish FSA (Finansinspektionen) insider register. Market data as of 5 June 2026, at a share price of around SEK 135. Five-year metrics and the owner-earnings estimate are my own.
How I work. I read the Korean and Japanese filings myself. AI helps me with translation and with checking the arithmetic. Every judgement, model and conclusion here is mine.
Disclosure. Assume I own shares in every company I write about, and read accordingly. I don’t disclose individual positions or sizes.
Disclaimer. This is analysis for discussion, not investment advice, and not a recommendation to buy or sell anything. I’m not your adviser. The figures come from primary filings but I make mistakes, so check them yourself before you act. Micro caps carry real liquidity and volatility risk, and you can lose your money.